
Responsive, Elegant, Sophisticated Yet Simple Sales Performance Reporting.
We know the drill! It’s Monday morning, you live and breathe sales, and you want to get cracking on making those calls, chasing your leads, and closing those deals.
But……
As if to suck the life out of you, management needs a sales meeting. Hold that thought, management needs figures and performance results. The number crunchers need their say. What needs crunching, you ask? “Numbers,” they respond humorlessly.
- What did we close last week?
- What’s in the active deal pipeline this week?
- Did we close more last week than two weeks ago?
- What’s our month-to-month growth?
Your palms are sweaty, knees weak, arms heavy. You feel yourself losing your clients already, hold the confetti.
Sales are measured by numbers, but to a salesperson reporting takes time. Hours better spent on building relationships and pushing through signatures. Reporting is retrospective analysis rather than forward-facing deal closure. Unfortunately, forward-facing relationship building doesn’t please the numbers guys, and so the sales team throws together a lifeless sales report that might keep management at bay for another 7 days.
Not only are sales meetings tedious, but they are also expensive! In his blog, “How long should a meeting last?” Randy McCloskey predicts that your sales meetings cost your firm $340 per hour. Increase that to $1050 per hour if senior management is involved. A pricey few hours for your company to chew through first thing on a Monday morning.
At Tubular, we believe successful companies are built on using time efficiently. We have developed our sales reporting feature so it is responsive, intuitive, elegant and most of all simple, providing any company with the real-time stats they need to analyse their sales funnel.
Join the growing number of companies adopting Tubular, and learn why we can improve sales reporting, performance reporting, and organisational reporting.
The benefits of weekly, monthly and quarterly reports.
1. Weekly reporting
Aaaah! The joys of weekly reports. Those who cut their teeth on B2B sales can know that at times not a lot can progress in a week. Therefore, weekly reports can at times look relatively similar.
To combat this, we recommend you bring other Key Performance Indicators (KPI’s) that turn your weekly sales reports from sluggish stationary charts into reactive, responsive reports.
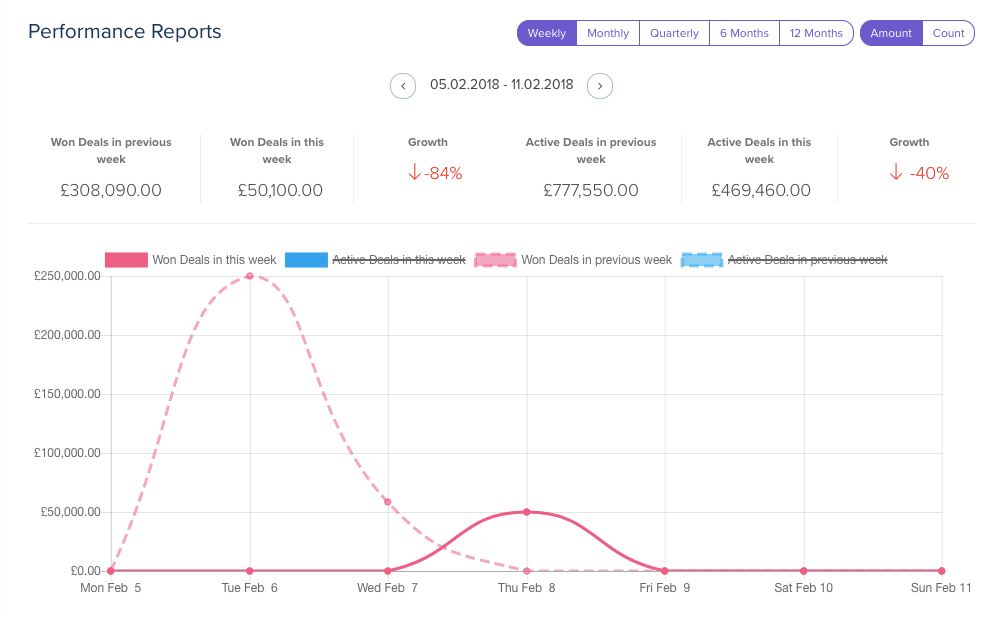
Start by measuring not only closed deals, but also active deals, so you get a balanced view of how healthy your sales pipeline is.
“An active deal is a deal within the various stages of your sales pipeline; so that deals are not won, lost, trashed or archived.”
So by merely clicking the overlay of deals won this week vs deals won in previous week, I can start seeing the positive or negative weekly growth.
Pros – Errors, sticking points in the sales funnel. Any decrease in performance is quickly isolated before it becomes a long-term problem.
Cons – Some sales lifecycles are too long to see any drastic change on a weekly basis.
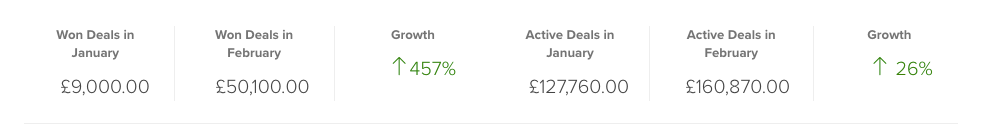
2. Monthly reports
An instant snapshot of a monthly report is where you can start making up-to-date actionable decisions that positively affect your sales pipeline.
Seeing your monthly closure rates can engage and incentivise your team to take affirmative steps to close their deals. Who knows? You might even find value in resuscitating some of the stagnant deals.
You can even dive into the revenue closed by sales rep by clicking the avatar on the right-hand side to get your personalised reports.
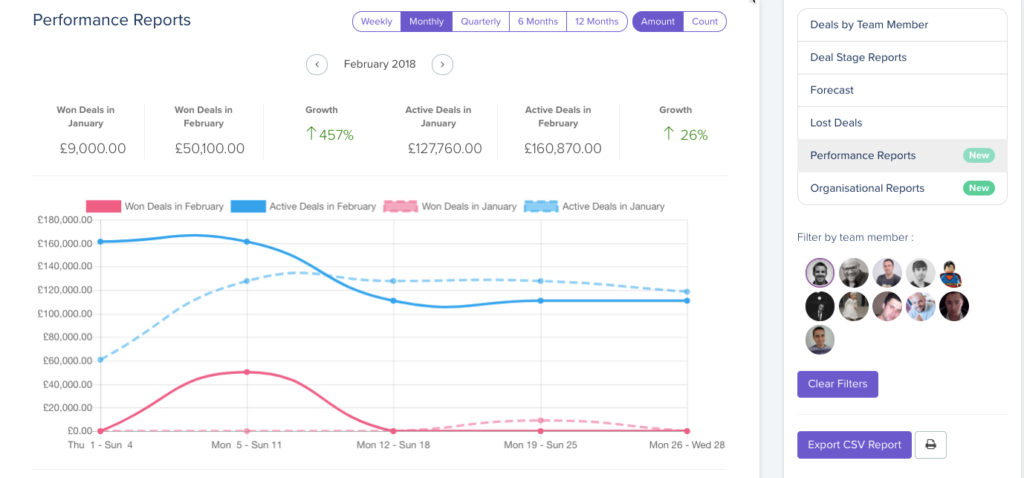
Pros – Percentage growth of deal flow and pipeline makes it easy to pick up the slightest of increase or decrease of performance.
Cons – Honestly, every company should have a monthly sales report and analyse their active deal flow through the month.
Quarterly reports
The time of the year where a brief overview isn’t enough. Sales reps need to stand up and report on segments, deal size, lead sources and closure ratios. Luckily, with Tubular this is not a difficult exercise. Quarterly reports are drawn up instantaneously for you and correlate with the data that has been uploaded to Tubular during the previous quarter.
Don’t forget that your sales quarter constitutes bonus time, so don’t be scared of pulling away from the pack to show off your position with the Tubular Sales Leaderboard.
Annual Sales report
Everything is a panic at year end, the month can be short, or you may find yourself having to navigate your way around a short month interspersed with holidays with the same targets to hit, meaning hours upon an hours of distracting sales meetings.
Create calm amongst the ranks by having your annual sales reports ready at the click of a button. Watch how to build your Tubular reports by watching this video here.
Go on. This one is on us. Take the weekend off.

