
Cash flow forecast through your Sales Pipeline!
Its great to use your Sales Pipeline software to visualize your Sales Funnel. The real magic happens when you use this data to forecast cash projections, forecasts, and cash flows. Performing these activities on a daily, weekly and monthly basis takes seconds within Tubular, and may very well save your company from overexerting themselves cash flow wise.Here is how you can
Performing these activities on a daily, weekly and monthly basis takes seconds within Tubular, and may very well save your company from overexerting themselves cash flow wise. Here is how you can utilize cash flow projections within Tubular to improve the control you have over your business.
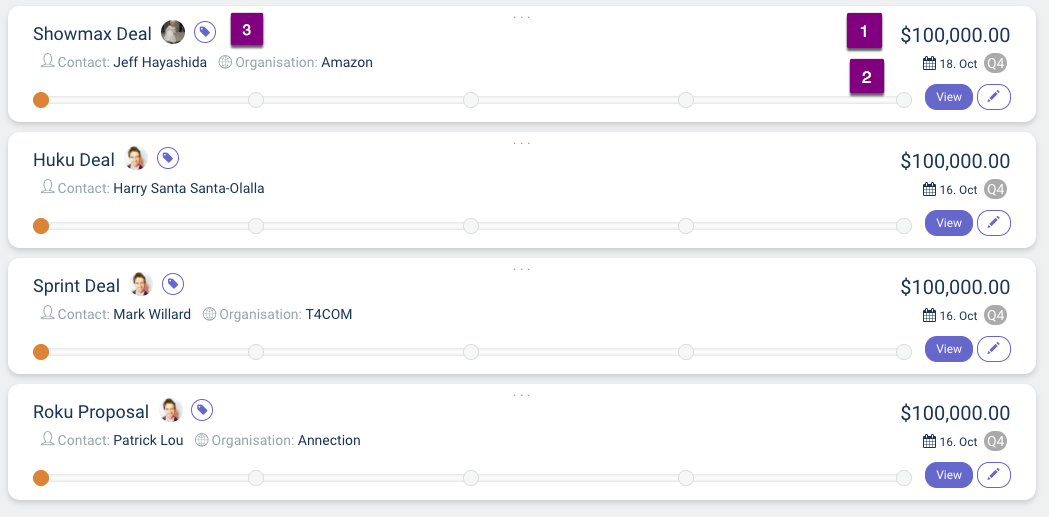
In the above – I have 4 deals, all with a value of $100,000 with a close date of Q4 (October 2017)
A total Payment Value $ 400,000 is expected to reflect in your sales account in October 2017.
No Payment Terms are attached to the Deal
No Forecasts are attached to the Deal.
This is how it reflects in your reports:
As per above – $400,000 should reflect in the cash flow forecast in October – Kaching!
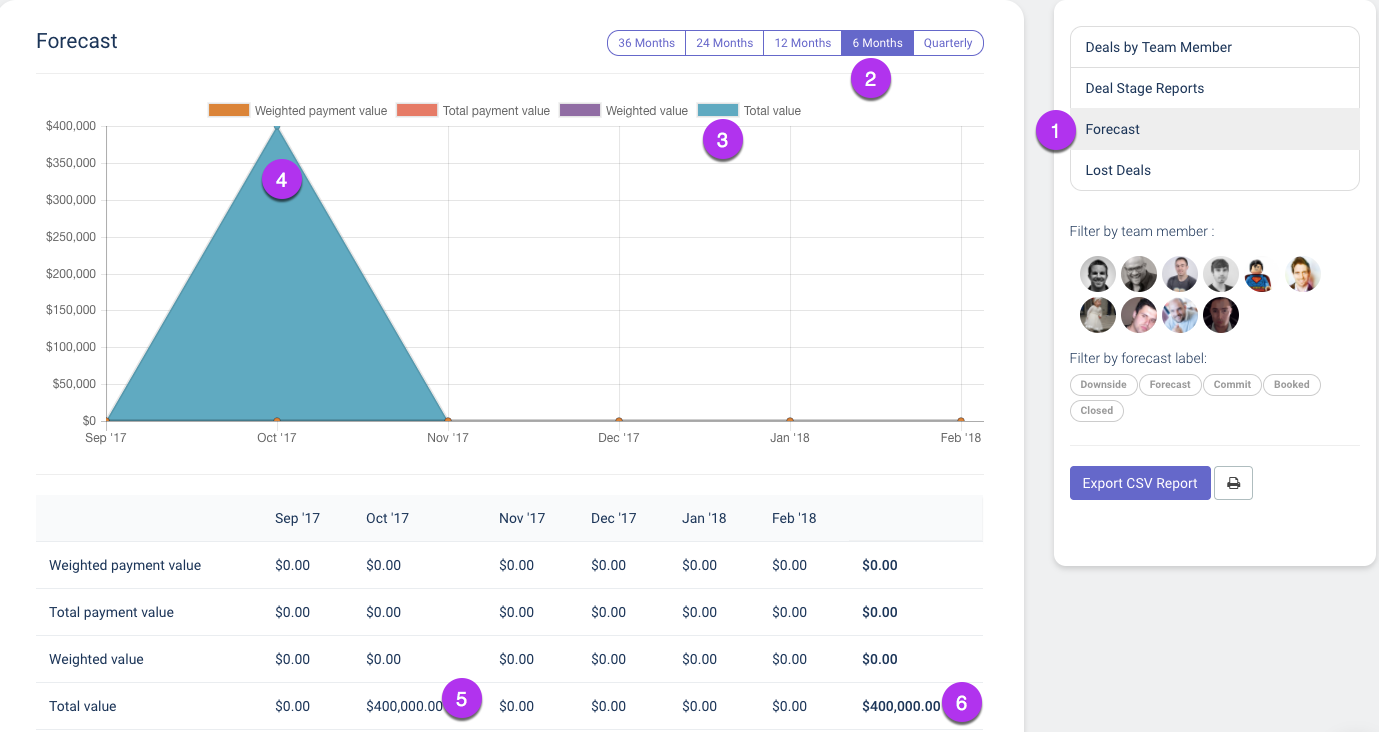
A little description:-
- Remember we are Forecasting
- 6 monthly Forecasts look good!
- Total Value = The total value of closed business
- Closing October Q4 – 2017
- Again Total Value closes $400,000 – Remember no forecasts and no payment terms
Weighted Payment Value = Remains Empty
Total Payment Value = Remains Empty
Weight Value = Remains Empty
So – Let’s change a variable:-
4 deals, 4 deals all with a value of $ 100,000.
- Showmax Deal – Has a 10% Probability closing. (Forecast label)
- Huku Deal – Remains the same
- Sprint Deal – Remains the same
- Roku Proposal – Remains the same
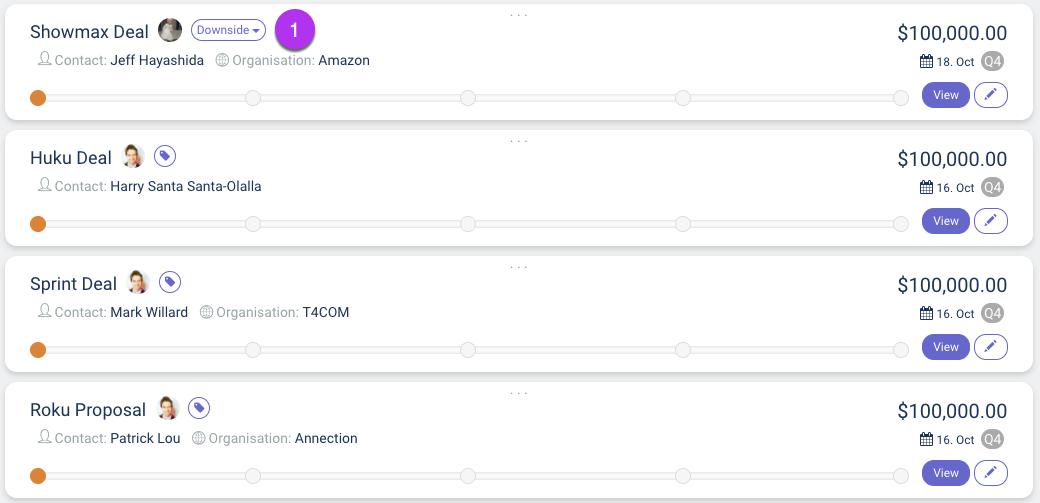
In Settings, I have allocated a 10% Probability Value to my Downside Forecast.
So I expect:-
- Showmax Deal – 10% of $100,000 = $ 10,000 USD if I remember from Grade school!
- Huku Deal – $100,000 in Cashflow closing October
- Sprint Deal -$100,000 in Cashflow closing October
- Roku Proposal -$100,000 in Cashflow closing October
This is how it reflects in the Reports Tab.
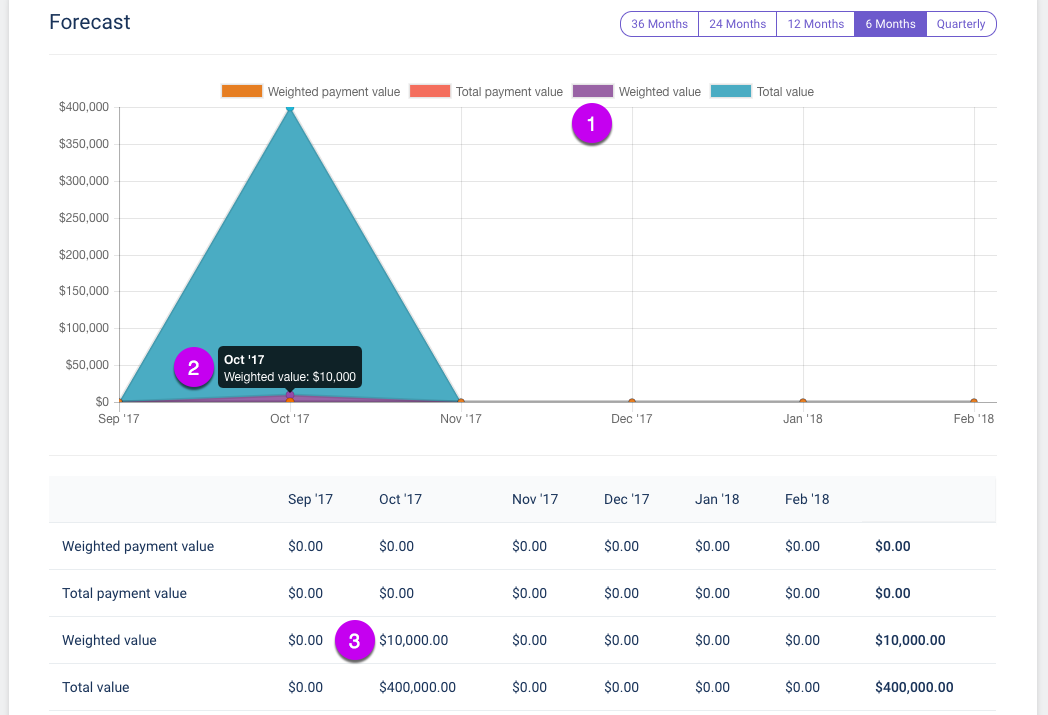
- Because you have a Forecast label on one deal – but no others- you are expected to forecast $10,000 as a Weighted Value.
- Weighted Value = $ 10,000
- This presents itself as a Weighted Value $10,000 in anticipated cash flow.
Next step –
Our Hulu Deal closes in October (same as before) but the client pays –
50% in January (2018) and
50% in February (2018),
Your reports will look like this.
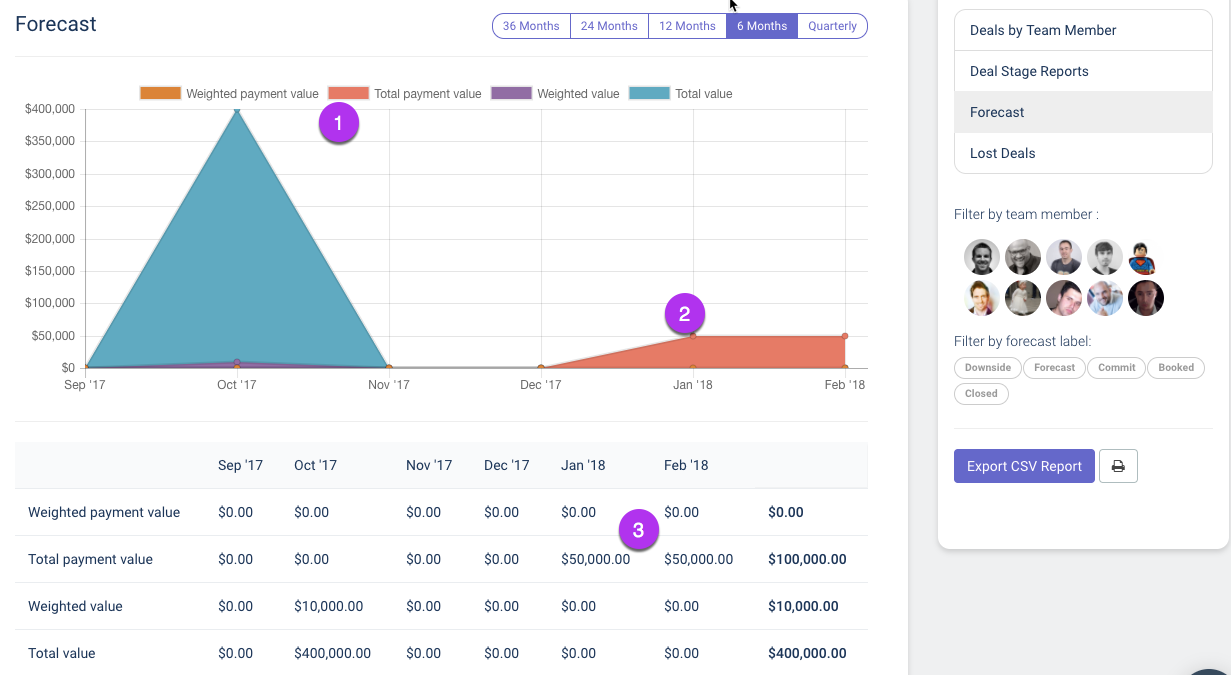
- Total Payment Value shows the Recurring Payments, or payment terms – associated with your deals in which you have staggered payments
- This reflects in January and February’s expected income.
- This reflects in the total payments expected through deals with payment terms.
Use these quick tricks to get your sales pipeline and cash flows in Sync!

